At the time of the August 2003 Mars opposition much was made of the “moment of closest approach” and I began thinking about how long this “moment” would last, within various limits, such as the diameter of Mars, or even a mile, or a foot. The distance between the planets is not a dynamically significant measure in this case, since the force between them is small and doesn’t substantially affect their relative motion, so this is a problem in “kinematics”, meaning mere description of the motion. Furthermore, we only require an approximate formula for this distance around the time of closest approach.
With the May 31 2013 close approach to earth of “(1998) QE2”, this subject again presented itself. This time I watched a webcast of a telescopic camera image which had live commentary excitedly announcing the moment, or at least the minute of close approach, so I got to thinking about it again.
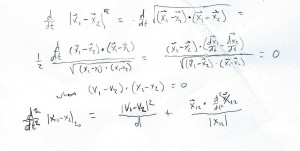
This time, I decided that a good model was a straight line pass at constant speed, and derived a formula for the distance as a function of time based on that. In 2003, I had used the approximation of circular motion obeying Kepler’s Third Law to derive the relative acceleration of Earth and Mars. Revisiting the idea, I realized that I had neglected the effect of overtaking, which my new straight line model emphasized. So I thought I should try a derivation, and putting pencil to paper, I immediately wrote down the following, and I was very pleased to see that it settled the whole thing in the simplest possible way:
… the two terms represent the kinematical “acceleration” of the distance value, and the true dynamic acceleration projected along the unit vector of the displacement between the bodies, or planets. ( Note d = |x12| t0 ).
QE2 Close Approach
With this in hand we may examine the NASA ephemeris data for the close approach of (1998) QE2, which conveniently features “delta” and “deldot”, which are the distance in AUs and the time derivative of same. “dot” is here the Newtonian convention of indicating the time derivative of a variable.
This table is excerpted from results obtained with the JPL HORIZONS web interface. You’ll have to search for “1998 QE2” and then change the start and stop times, and the step size to 1 minute, then click Generate Ephemeris. There is a lot of other data in the table, as you’ll see.
In the excerpted data below, note that the deldot values are almost evenly spaced with a constant difference of about 0.0011649 km/sec, representing a pseudo-acceleration along the line of sight of 0.0011649 km/sec/minute. So the appearance along the line of sight is similar to that of a thrown ball, say, rising towards a viewer positioned at a height, then falling away. Note that the acceleration is 1.11649/60 m/sec2 or about 0.0019 g , so this is a rather slow motion affair. It takes about 1 minute for the speed of approach/recession to decrease/increase by 1 meter/second .
Date Time ( UT ) delta ( AU ) deldot ( km/sec)
2013-May-31 20:44:58.068 0.03917532423283 -0.0163077
2013-May-31 20:45:58.068 0.03917531792555 -0.0151429
2013-May-31 20:46:58.068 0.03917531208546 -0.0139781
2013-May-31 20:47:58.068 0.03917530671257 -0.0128133
2013-May-31 20:48:58.068 0.03917530180688 -0.0116484
2013-May-31 20:49:58.068 0.03917529736839 -0.0104836
2013-May-31 20:50:58.068 0.03917529339710 -0.0093188
2013-May-31 20:51:58.068 0.03917528989301 -0.0081540
2013-May-31 20:52:58.068 0.03917528685613 -0.0069891
2013-May-31 20:53:58.068 0.03917528428646 -0.0058243
2013-May-31 20:54:58.068 0.03917528218400 -0.0046594
2013-May-31 20:55:58.068 0.03917528054875 -0.0034946
2013-May-31 20:56:58.068 0.03917527938071 -0.0023297
2013-May-31 20:57:58.068 0.03917527867989 -0.0011649
2013-May-31 20:58:58.068 0.03917527844628 0.0000000
2013-May-31 20:59:58.068 0.03917527867989 0.0011649
2013-May-31 21:00:58.068 0.03917527938073 0.0023297
2013-May-31 21:01:58.068 0.03917528054878 0.0034946
2013-May-31 21:02:58.068 0.03917528218406 0.0046595
2013-May-31 21:03:58.068 0.03917528428656 0.0058244
2013-May-31 21:04:58.068 0.03917528685629 0.0069893
2013-May-31 21:05:58.068 0.03917528989324 0.0081542
2013-May-31 21:06:58.068 0.03917529339743 0.0093191
2013-May-31 21:07:58.068 0.03917529736885 0.0104840
2013-May-31 21:08:58.068 0.03917530180750 0.0116489
2013-May-31 21:09:58.068 0.03917530671338 0.0128138
2013-May-31 21:10:58.068 0.03917531208650 0.0139787
2013-May-31 21:11:58.068 0.03917531792686 0.0151436
2013-May-31 21:12:58.068 0.03917532423446 0.0163085
If we change the step size to 1 hour, we see that the spacing of deldot still remains close to a constant, but a systematic drift is evident, represented by a linear increase in the spacing with time, meaning the (pseudo) acceleration increases with time in the direction away from the earth POV, so the approach slows down, but the retreat speeds up.
2013-May-31 08:58:58.067 0.03929608858667 -0.8350130
2013-May-31 09:58:58.067 0.03927682497794 -0.7658902
2013-May-31 10:58:58.067 0.03925922624191 -0.6966541
2013-May-31 11:58:58.067 0.03924329499832 -0.6273135
2013-May-31 12:58:58.067 0.03922903365661 -0.5578770
2013-May-31 13:58:58.067 0.03921644441785 -0.4883535
2013-May-31 14:58:58.067 0.03920552926676 -0.4187518
2013-May-31 15:58:58.067 0.03919628997722 -0.3490808
2013-May-31 16:58:58.067 0.03918872810782 -0.2793494
2013-May-31 17:58:58.067 0.03918284500170 -0.2095666
2013-May-31 18:58:58.067 0.03917864178520 -0.1397414
2013-May-31 19:58:58.067 0.03917611936989 -0.0698829
2013-May-31 20:58:58.067 0.03917527844677 0.0000000
2013-May-31 21:58:58.067 0.03917611949120 0.0698981
2013-May-31 22:58:58.067 0.03917864276007 0.1398025
2013-May-31 23:58:58.067 0.03918284829222 0.2097040
2013-Jun-01 00:58:58.067 0.03918873590808 0.2795937
2013-Jun-01 01:58:58.067 0.03919630521201 0.3494624
2013-Jun-01 02:58:58.067 0.03920555558842 0.4193011
2013-Jun-01 03:58:58.067 0.03921648620645 0.4891009
2013-Jun-01 04:58:58.067 0.03922909601848 0.5588527
2013-Jun-01 05:58:58.067 0.03924338376138 0.6285477
2013-Jun-01 06:58:58.067 0.03925934795697 0.6981768
2013-Jun-01 07:58:58.067 0.03927698691478 0.7677314
2013-Jun-01 08:58:58.067 0.03929629872991 0.8372025
Some fairly simple considerations of the nature of our approximate calculations will show why it works as well as it does, and give a value for the “next order” of deviation from it.
THE INERTIAL EARTH FRAME OF REFERENCE
Just as the Space Shuttle bay provided a “free fall” environment as it orbited the earth, the vicinity of earth is a “free fall” environment for objects near it. That is, we do not need to know what orbit they are following, but can consider them to be in free fall with the earth. Two forces limit this assumption. The first of course is the gravity of the earth itself, and the second is the “tidal” or differential field of the sun’s gravity near the earth, which in first approximation grows in proportion with distance from the earth.
Which of these is greater for our case of a close approach at about 0.04 AU ?
The force of earth’s gravity, measured by g at the earth’s surface, diminishes in inverse proportion to the square of the distance from the earth, measured in earth radii, re . Since 0.04 AU is about 940 re, We expect an acceleration due to earth’s gravity of about 1/88400 g or 0.000011 m/sec2 at that distance.
The acceleration due to the sun’s gravity at 1 AU is measured by the centripetal acceleration of the earth in its orbit, that is ( 2pi/1 year )2 1 AU, which comes to 0.006 m/sec2 . The tidal force is measured by the distance in AU times this value, or 0.000240 m/sec2, about 22 times as great as the earth’s gravitational pull. The exact direction and magnitude of the solar tide depends on the relative position of the object, just as the tides of the earth ocean vary with the position of the moon and the sun in the sky, but we may consider the value, once calculated, to be constant in the next order of approximation.
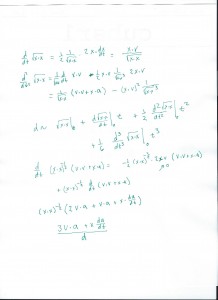
Here is a derivation extending our approximation to the “third order” in time:
The expression at the bottom has a “kinetic” term linear in the (dynamic) acceleration and a term representing a variable dynamic, or true, acceleration. If we assume a constant dynamic acceleration, the second term vanishes of course. The first term is intuitively due to the acceleration along the path perpendicular to the line of close encounter, since time, in this case, signifies only the position along that line, so we may regard acceleration as a displacement in the time scale. Got it? OK then! Actually, this is how I conceived the idea in the first place, and I did the derivation just to provide a formal justification.
Terminat hora diem, terminat auctor opus

