Ozymandias

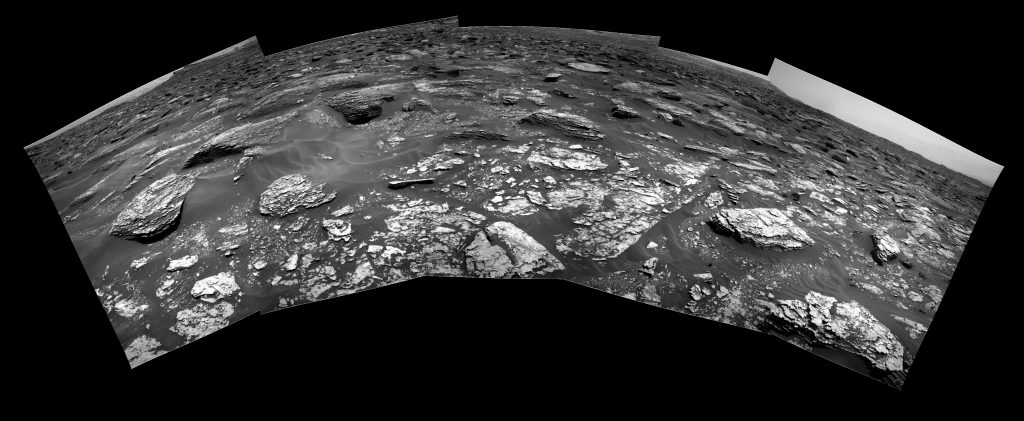
The latest vistas from Curiosity put me in mind of Shelley’s sonnet.

“Look on these works, ye mighty, and despair.”

Of course, these are not the ruins of some civilization, but purely inanimate landscape. Yet, everything takes a form through a very leisurely evolution, compared to earth, and there it all sits, like some incredible junkyard.

Here is a simple panorama from the mastcam images of sol 1698.

… click to enlarge!

… Here’s the same scene on sol 1700, except for a forward displacement of Curiosity’s POV.

The very prominent knoll in the left foreground on sol 1700 can easily be located in the left middle ground on sol 1698.

The prominent features from the center to the lower right in the sol 1698 view are no longer in view on sol 1700.

Here’s a sol 1705 Navcam view which can be matched up with the sol 1700 Mastcam view, above.

Curiosity has advanced to a position in the sol 1700 view, just in front of the 3 large “rocks” near the center of that view. This formation appears in the sol 1705 view on the left center. It can be identified by the form of the sand, or dust, drifted against them.


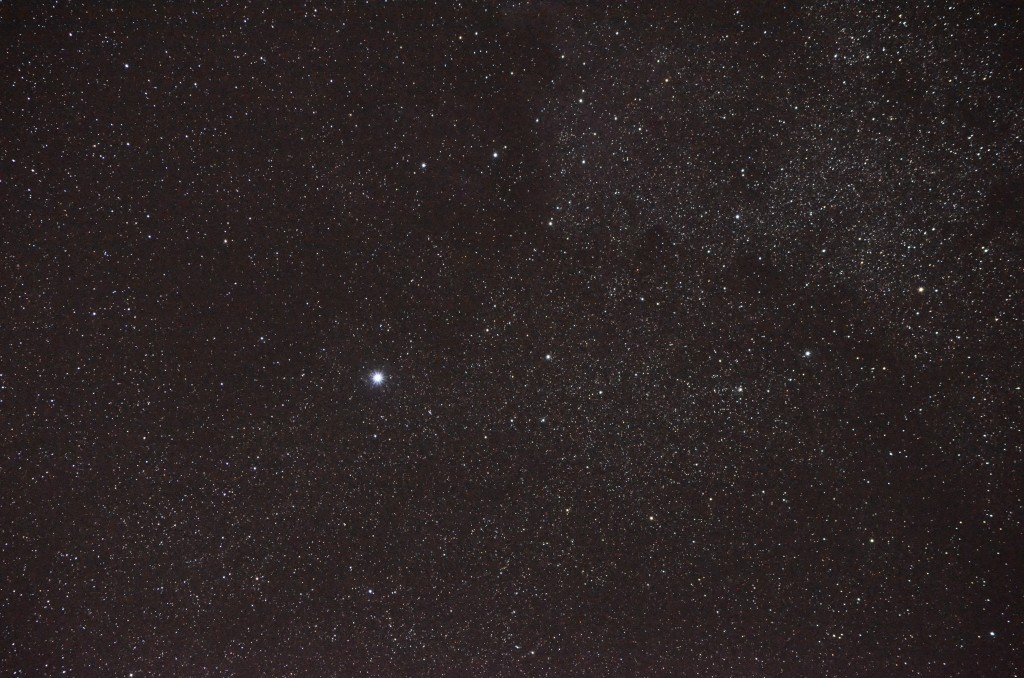
Meet the Monster

That monster is the star, Deneb, familiar in the constellation Cygnus in the northern sky. It is among the brightest stars in the sky, but what cannot be obvious is that it far outstrips its visual rivals in intrinsic brightness, so that it is the bully in our neighborhood. It is a magnitude 1.25 star at a distance of 800 parsecs.

Now, the Sun has an absolute magnitude of 4.83, which is by definition its ideal visual magnitude at a distance of 10 parsecs. So to have a visual magnitude of 1.25, the Sun must appear 10^(.4*(4.83-1.25)) = 27 times brighter than it does at 10 parsecs. That means it must be 1/sqrt(27) times as distant , or about 3.7 parsecs away, or 216 times closer than Deneb, to show the same visual magnitude.

So, conversely, the earth would have to be orbiting Deneb at 216 AU if Deneb were to have the same apparent brightness as the Sun. That’s over five times the distance of Pluto from the Sun, which averages about 40 AU.

The period of an orbiting body is given by M/r^2 ~ r/T^2 or T ~ sqrt( r^3/M ), which embodies Kepler’s third law for a central body of a given mass, but allows us to account for a variable mass. Deneb has about 19 solar masses, so the “year” of this Deneb-earth would be sqrt( 216^3/19 ) = 728 earth years. Well, at least that’s comprehensible!

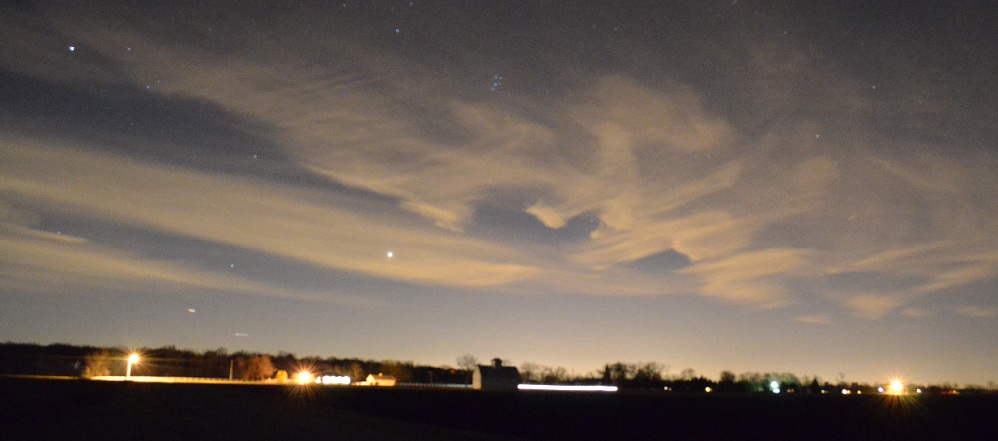
I was led into these contemplations after having taken the following photograph of Deneb, with its star background in the Milky Way, using my Nikon D5100 mounted on my telescope purely for its use as a “clocked” mount. The exposure is about 20 seconds, so the lack of guidance is not so bad, as long as I get reasonable alignment, for which purpose I have a well practiced system! … ( click to enlarge )

deneb1

Let us now praise Neil Armstrong

I was working on this, having for some unknown reason taken a renewed interest in the Apollo program, and Apollo 11 in particular. I was reviewing the material at The Apollo Lunar Surface Journal on the Apollo 11 Landing, and was taken with the 5:00 AVI video clip attributed to Gone to Plaid. I can’t link to the video, as clicking on it just downloads it. I hope I don’t have 20 copies of it!

Anyway, it’s riveting. It’s got 1201 alarm stuff, and the final landing sequence down to “Contact light”. This is all from the camera mounted above the Lunar Module Pilot Position, on the right. It was mounted high so that it “looked down” as far as possible, and it’s a very different view from what Neil Armstrong had.

I got interested in all this because of the “boulder field” business, which caused Armstrong to take manual control and “go long” on the landing. In the film, you don’t really see it, so what’s up with that?

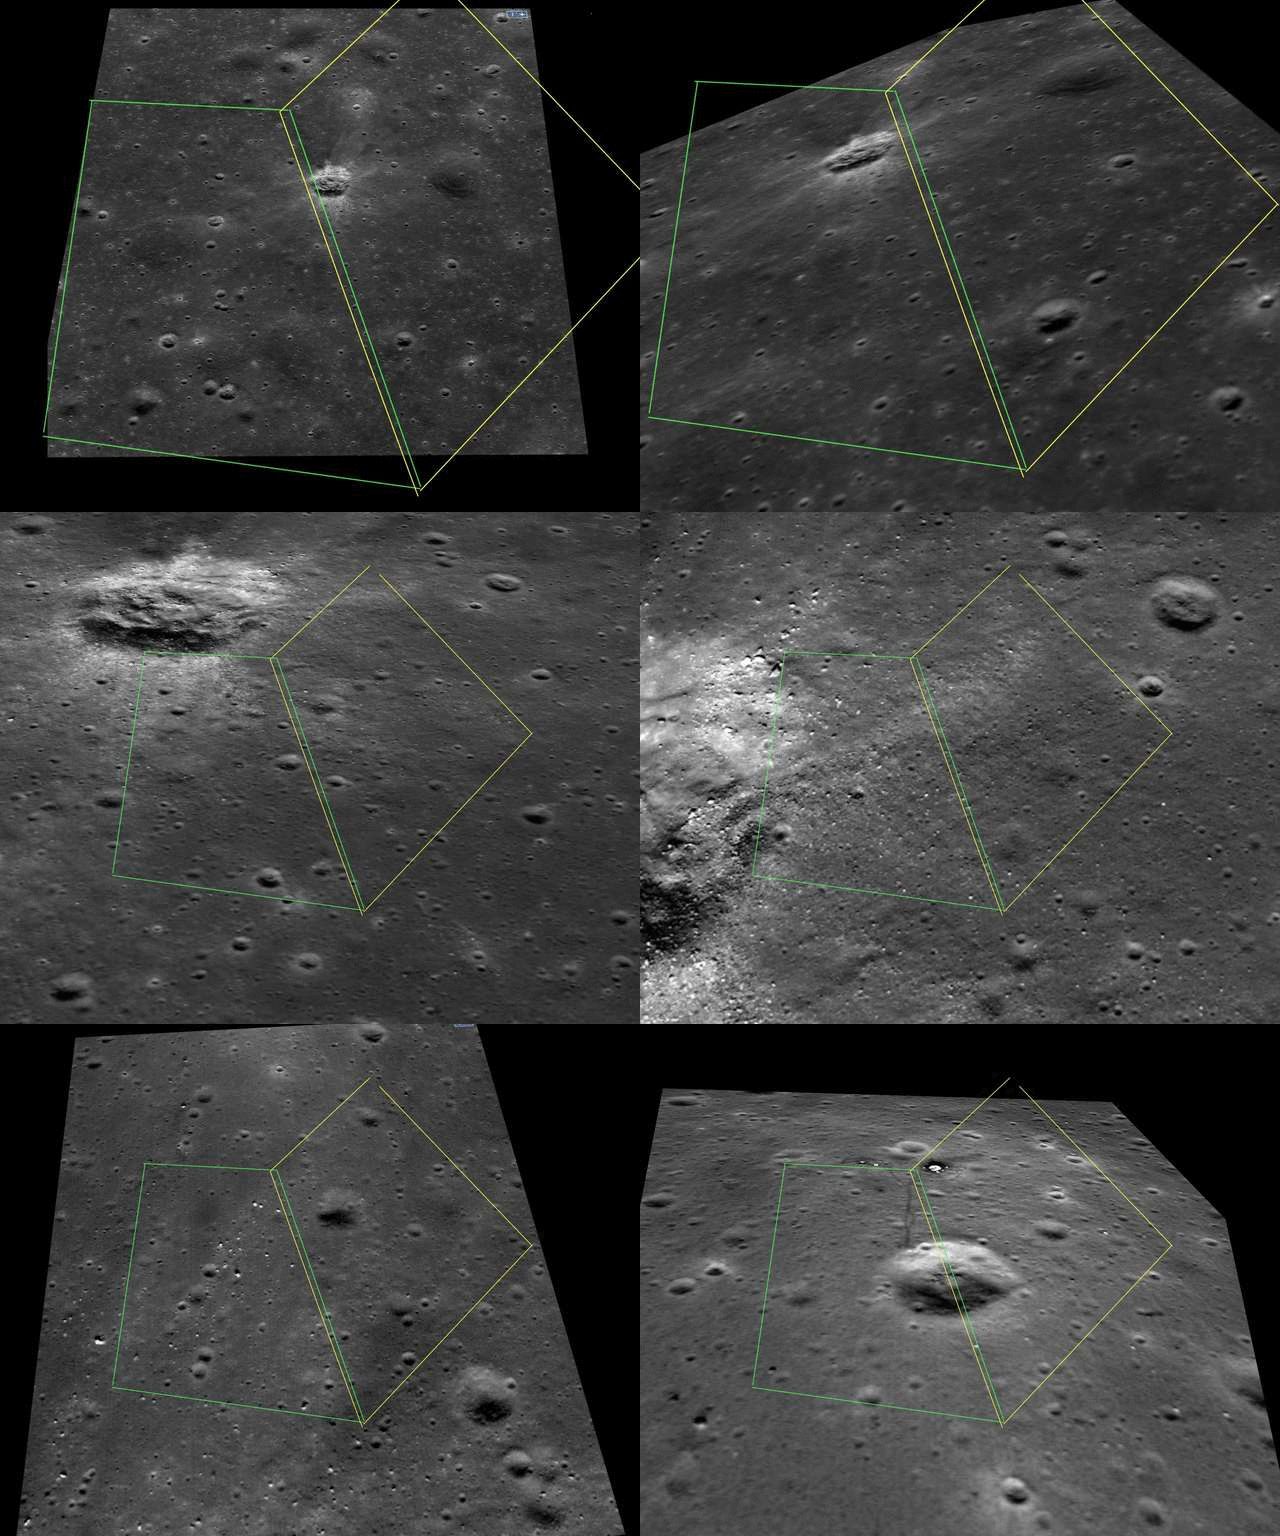
Well, really, I just stumbled into this from trying to locate the video frames in the LROC TIFF image of Tranquility base ( the skinny thing at the bottom of the page ) which shows Tranquility base down to the foot trails. Zoom in and out. It’s amazing.

So I got to matching this view with the video frames using Paint.net. Very time consuming! Especially when you think that there should be software somewhere that could match every frame seamlessly. Maybe someone’s done it.

The thing is that this gives a wider view, of which the camera view is just a part, and it occurred to me that I could infer Armstrong’s view from the symmetrically opposed window very easily. To be exact, it would be a view of a camera mounted on the opposite side under reflection through the center plane of the LM. This is taking into account the very extended “nose” of the LM, adjacent on each side to the windows, which confines the view of each window pretty much to its own side. So, I just took the geometric reflection of the camera view from the LM Pilot’s side to estimate the view from the Commander’s side. The first thing to notice is that the LM was apparently tilted to the Commander’s side to give him a more level and “deeper” view of the surface. Aldrin wasn’t even watching, anyway! He says he was too busy, but I might suppose this was all by arrangement.

The second thing to notice is that West Crater with its boulders was very much in view of the Mission Commander. Can you imagine?

Well, the following animated gif is pretty crude, but it is base on five second intervals starting at 2:06 of the video, and finishing just before touchdown, with the descent stage of the LM visible in the LROC image, indicating the touchdown point, of course.

Crude as it is, I think it shows that Armstrong had a clear view of “West Crater” with its boulder field, and I think you can see how he “skates” to go long at the end, and then has to deal with “Little West” at the last.

output_ijNsMc

Where is Dawn Now?

The JPL DAWN mission page has a button for Where is Dawn now?, which is in a drop-down menu if you click on Mission in the main menu on the left of the home page. Dawn of course is the spacecraft that visited the asteroid Vesta, and is now fast approaching Ceres.

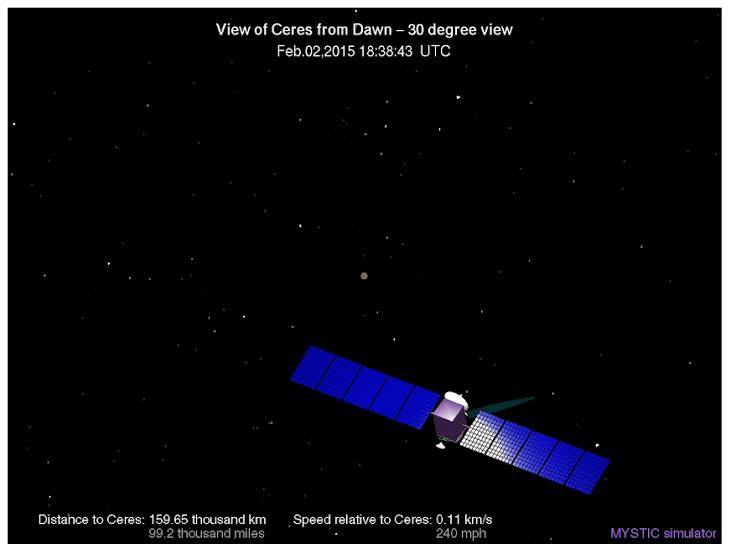
If you click on the graphic for Simulated View of Ceres from Dawn you get something like the following screen shot, from Feb 2, 2015
Feb02
Well, this tells us that it is approaching Ceres, in the middle there, but what stars are those? I couldn’t recognize them, and it was driving me crazy. I thought if I tracked it for a while, I’d see something I recognized, but this got me nowhere.

Note the credit to MYSTIC simulator. This is a tool they hold pretty close to their vest. It is apparently very powerful and used in their actual trajectory planning. Searching for it, I found a link to the NASA/JPL SOLAR SYSTEM SIMULATOR, which is nice, but it provides a much different format, and I was not getting anywhere with it either. Since it was all I could use, I went back a year or so and looked at some wide fields of view, and I was able to track it back to the present, where the background was identifiable as being near the head of Draco, in our Northern sky, but I still had no luck correlating the stars to the MYSTIC image.

The reason for this, I finally realized, is that the SSS tool had not been kept up to date with the latest course corrections ( I presume ) as it gives a different distance from Ceres than MYSTIC, which is official, I guess.

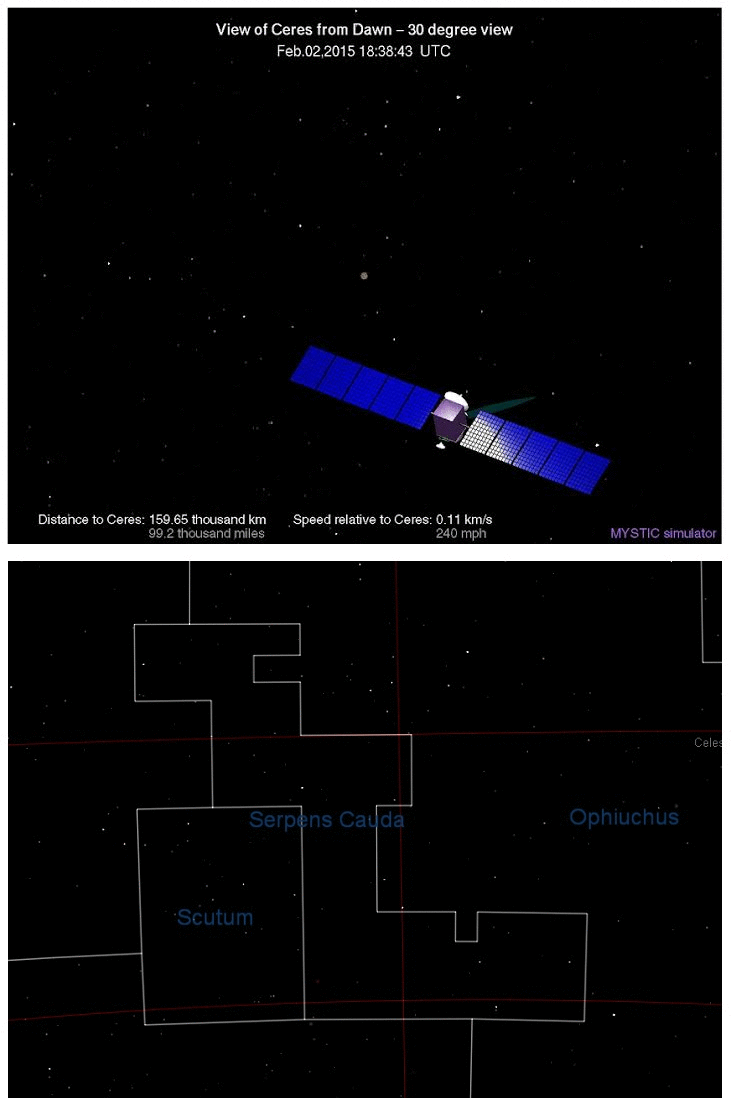
It was finally just dumb luck and persistence that enabled me to spot the correlating stars in my Starry Night software, and I’m sure you’ll agree it’s a good match:
output_DK8Cjt

Note that the four stars of the almost-square “box” that Ceres is in ( and remained in for several days, ) is comprised of stars from three different constellations. Two in Serpens Cauda, and one each in Scutum and Ophiucus. A very obscure asterism !

Update: Feb 13

Here’s the latest WIDN image:Feb13
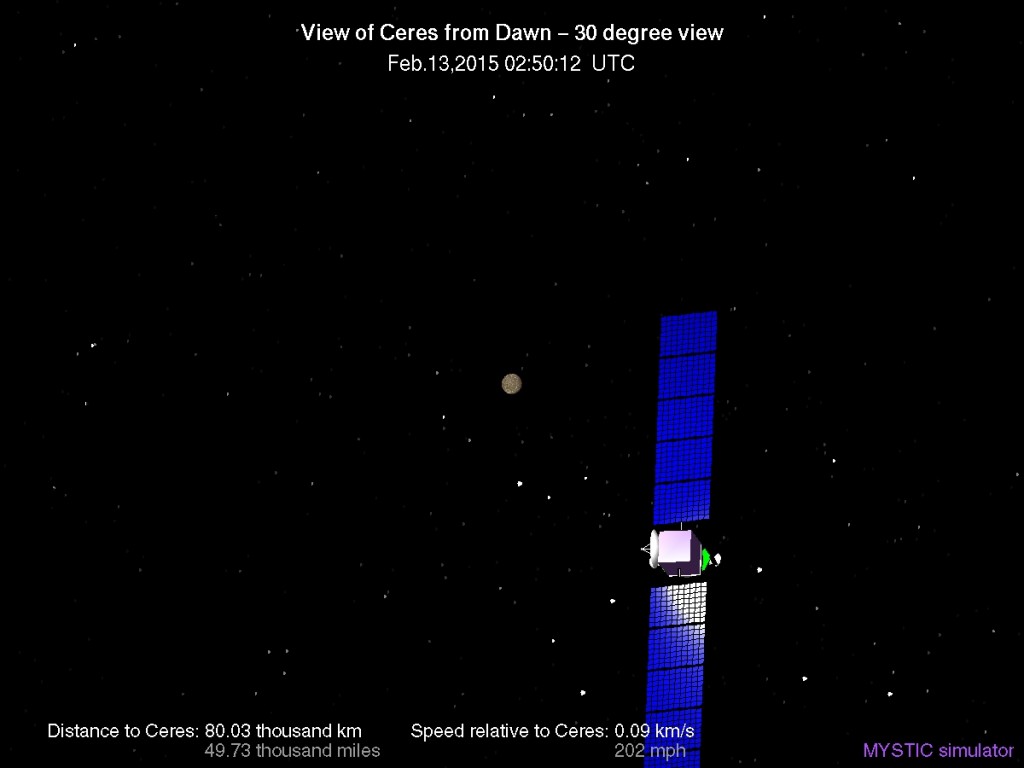
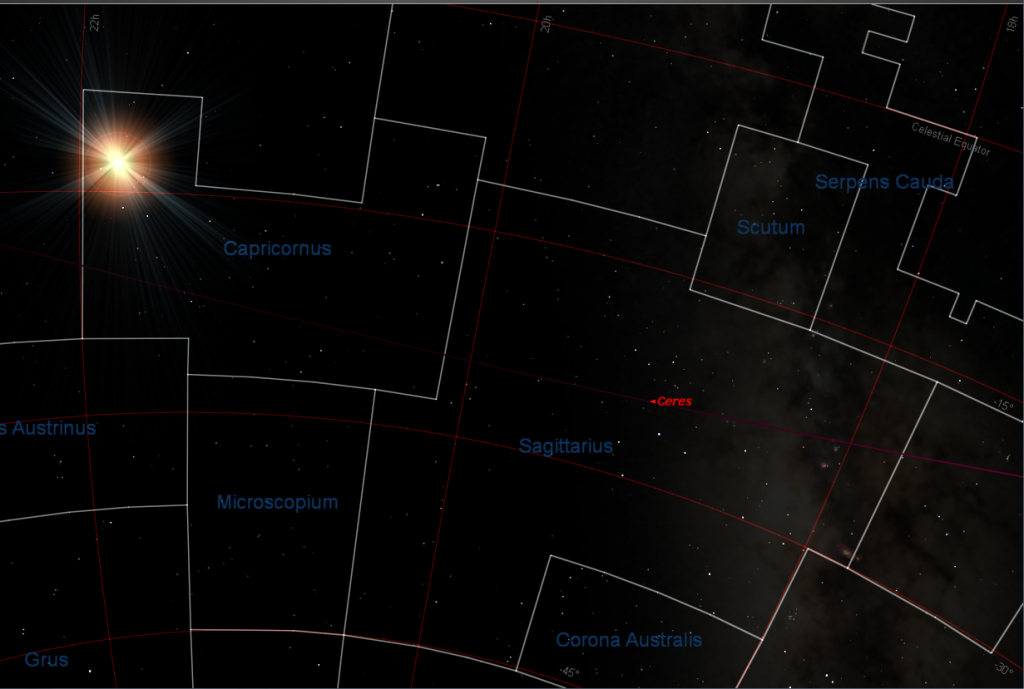
Ceres has “moved” ( in line of sight from DAWN ) “southward” ( in celestial coordinates ) into the constellation of Sagittarius. You might recognize the Sagittarian “teapot” asterism directly behind the bottom half of the representation of the DAWN space craft.

Now here’s the funny thing … DAWN is currently almost directly in line with Ceres from our terrestrial POV, as evidenced by this Starry Night view with Chicago set as the viewing location. Ceres is marked, along with it’s orbit. I adjusted the time to make the view align with the WIDN representation, and this view happens to occur at 9:46PM local time, on Feb 13, 2015. ( I did have to turn off the horizon mask, as this view is looking down through the ground at the given hour. Sagittarius rises just ahead of the sun at this season. )

I think this alignment has to be ascribed to coincidence, except that it does mean that DAWN is “rising” towards Ceres along an orbit which is “sunward” of Ceres’ orbit.
starry_Feb13_3

Update Feb 19

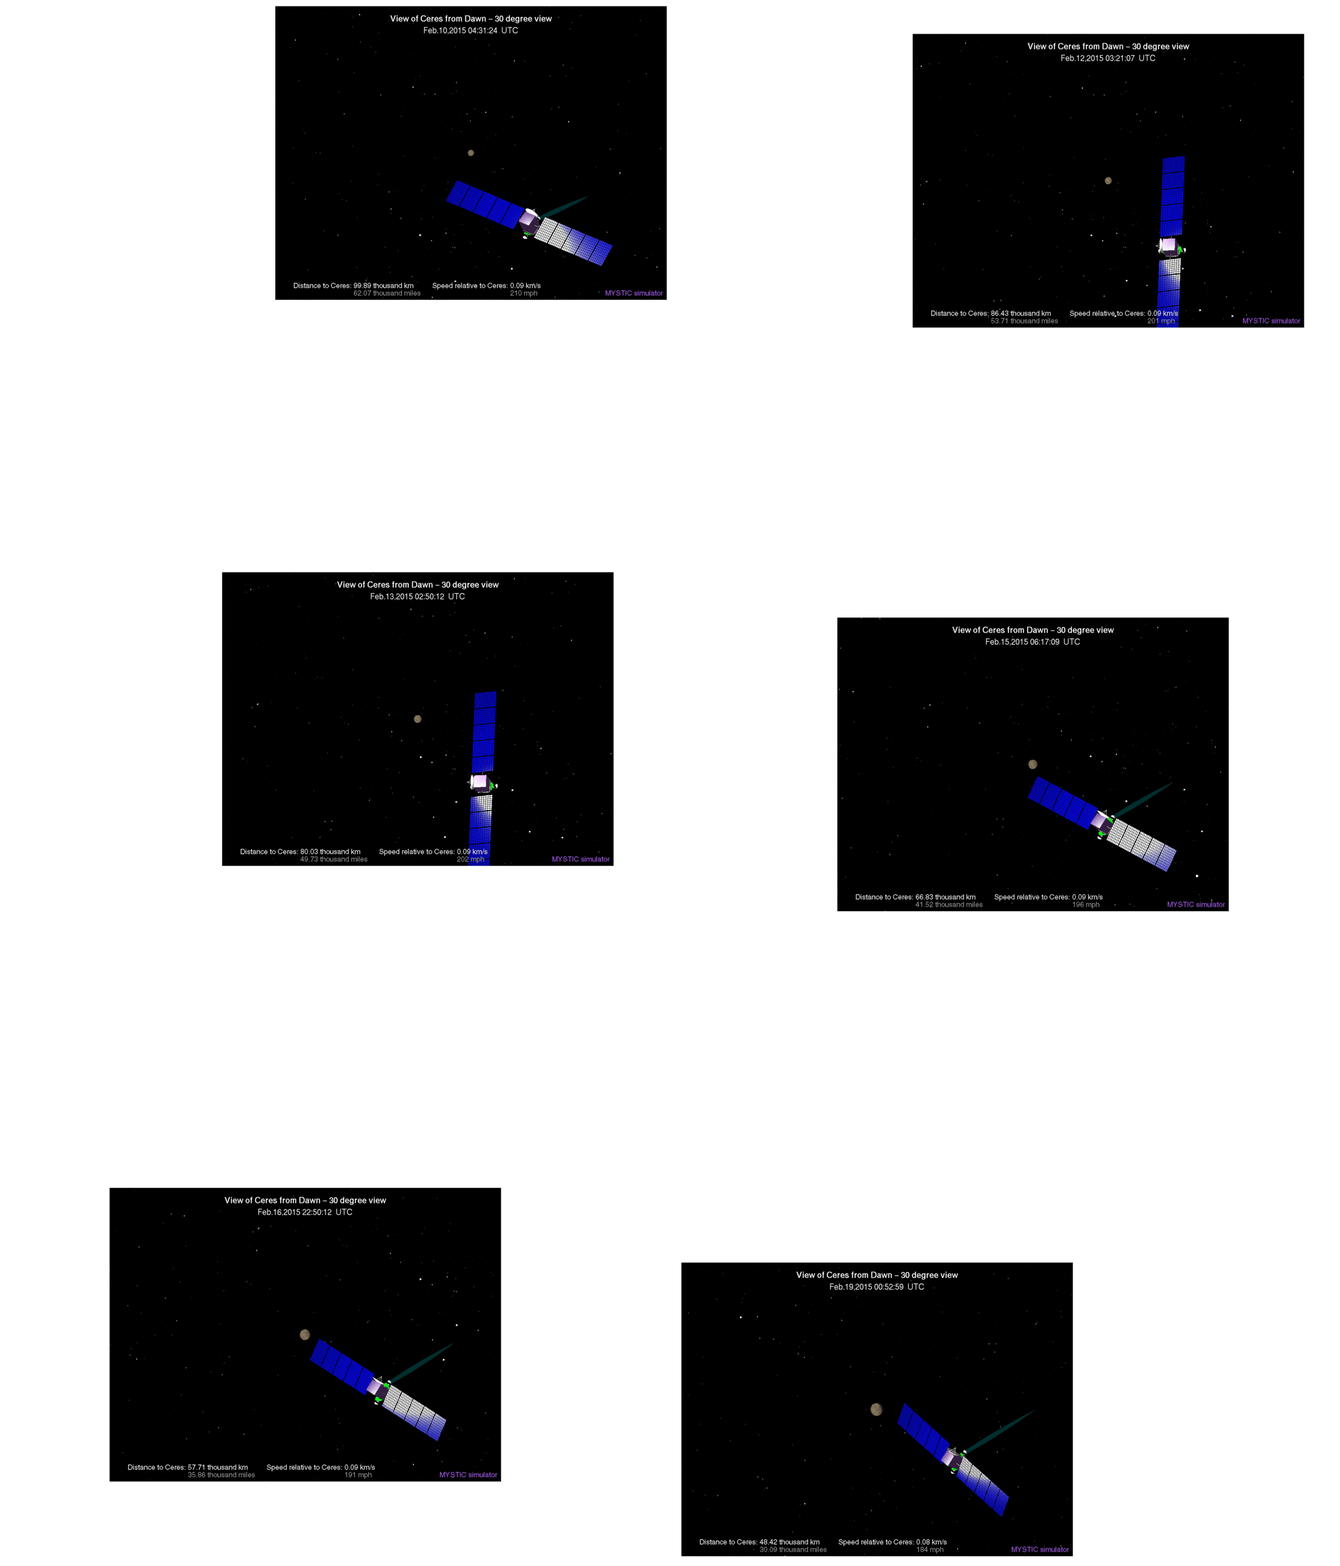
Here is an animated gif of a loosely spaced sequence of WIDN images, displaced to show a constant star background. This POV definitely gives the impression ( correct, I believe ) that DAWN is rising up through the ecliptic plane as it closes with Ceres. We can see Ceres sinking to the south below Sagittarius. It’s only going to get more interesting!output_4fYhUU
Feb 20 – A note on escape velocity

The Wikipedia article on Ceres gives a radius of 476 km and an escape velocity of .51 km/sec . This is the speed which gives an object a kinetic energy equal to the negative of the gravitational potential at this distance:

m v2/2 = m GM/R so v2/2 = GM/R

then the escape velocity at some r > R, say, is

vr = vR sqrt( R/r ) … very simple!

We note at Feb 20 03:16:52 we have r = 44580 km and v = .082 km/sec

but .51 km/sec sqrt(476/44580) = .053 km/sec

so DAWN is not gravitationally bound to Ceres at this point.

Note that the exact direction of the velocity is not important. Varying the direction just places the object with escape velocity at different places on various parabolic orbits.

Also note that the engine is not firing at this time. It seemed to be in braking mode the last few days, so has it shed any total energy?

On Feb 9 05:06:33 DAWN had r = 107010 km and v = .096 km/sec

The escape velocity at that distance is .51 km/sec sqrt(476/107010) = .034 km/sec

So the fact that it has shed considerable speed shows that it has gotten much closer to gravitational capture. If it were “drifting” it would have gained kinetic energy equal to the difference of the escape velocities at the two distances, requiring …

(v + delta_v )2 – v2 = .0532 – .0342

or v + delta_v = .104 km/sec

One more thing, braking with the same rocket is more effective at higher speeds, and one usually expects that a braking rocket will fire near close approach. The very low thrust of the ion rocket means that the approach has to be more “gentle”, which accounts for the braking having been in progress already. Let’s watch and see if DAWN does pick up a little more speed before the braking resumes, as it must.

… sure enough, DAWN is at 184 mph at Feb 20 13:22:16 vs. 182 mph at Feb 19 23:50:16
Kind of ironic that they give a more precise speed in mph vs. km/s, which is .08 for both times. 1 mph is ( exactly ) .00044704 km/s

Feb 21 – The Approach Begins

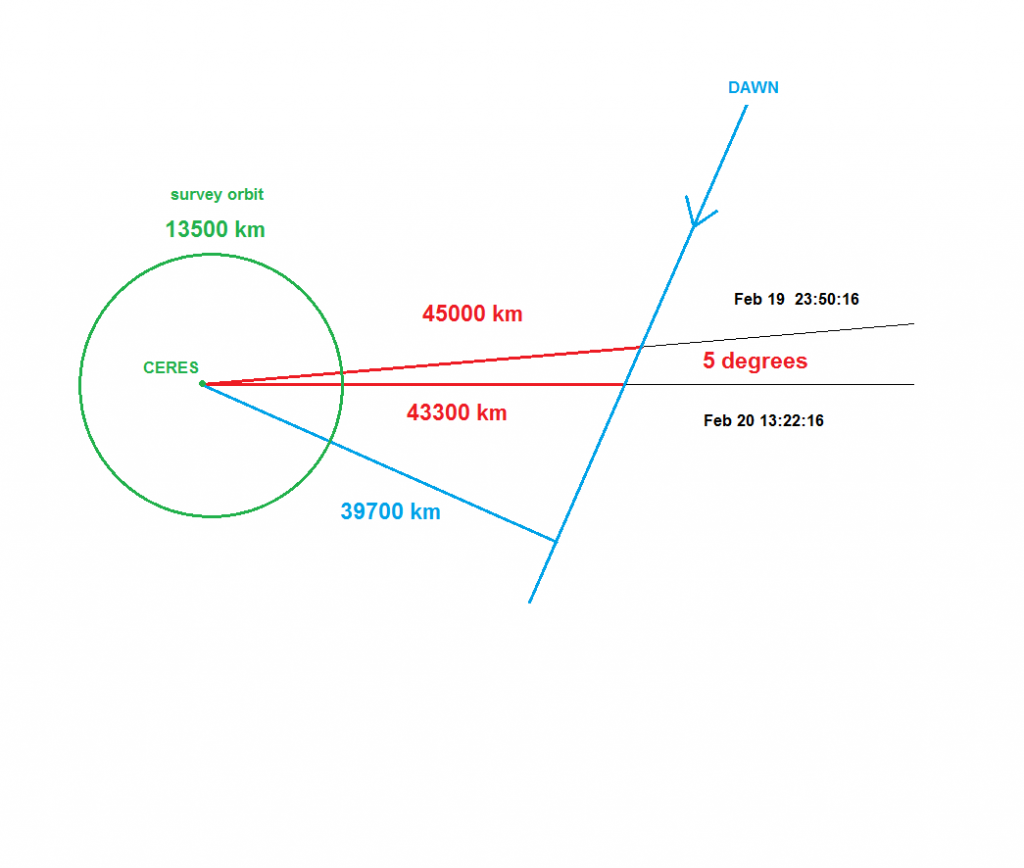
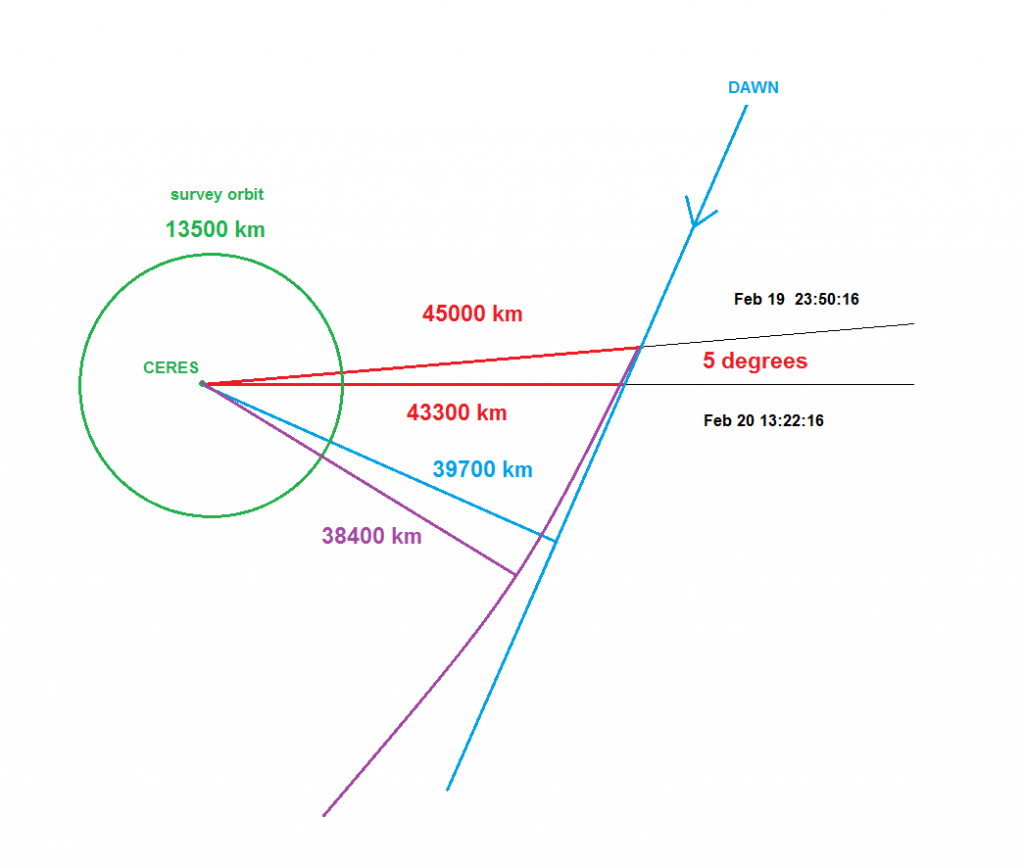
Here’s a diagram I drew “by hand” in MS Paint showing the approach of DAWN to “Ceres Space” I started with the MYSTIC graphics for the times shown. I used the given distances and measured the angle of 5 degrees from the background stars, using my STARRY NIGHT software. This gave me the blue line and the close approach distance of a straight line trajectory.
draft

But what about the gravitational attraction of Ceres? It seems that DAWN is not yet bound to Ceres, but it should be on a discernible hyperbolic trajectory.

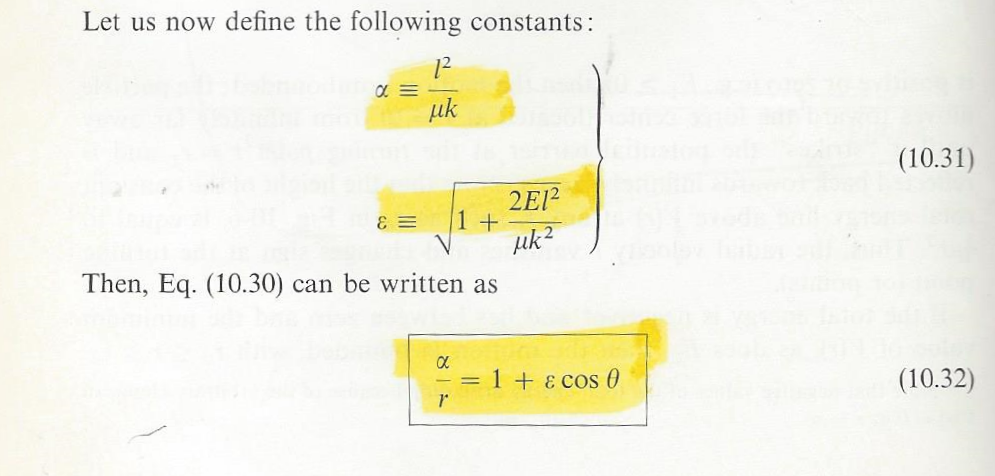
After some thrashing around with pencil and paper, I consulted my old copy of Marion’s CLASSICAL DYNAMICS and found the equation laid out for me, and highlighted to boot!
marion

I used my “hand built” yacc based calculator which features a plug-in definition capability. ( It actually pushes the defining string into the input stream when the defined symbol is encountered. )

Here are the defines I used:

define k “g*R^2”
define l “v*rp”
define alpha “l^2/k”
define E “v^2/2-k/r”
define e “(1+2*E*l^2/k^2)^0.5”

“mu”, for the “reduced mass” can be ignored when one body is much less massive than the other, m << M . Then mu ~= m and it cancels out of the expressions for alpha and e.

k is then GM, but I used GM/R2 = g to get k = g R2

Then setting the variables:
g= 0.00028
v= 0.083
rp= 39700
r= 45000
R= 476

( all in kilometers and seconds ) I just typed “alpha” and “e” to get the orbit parameters used in Marion’s equation 10.32, shown above:

alpha
1.71e+05
e
3.46

Then the distance of close approach and the angular displacement from the current position are given by:

alpha/(1+e)
3.84e+04
180/pi * acos( (alpha/r – 1)/e )
35.9

Perhaps surprisingly, these make sense! It says DAWN would approach to 38400 km at an angular displacement of 36 degrees from the current position, assuming it continued to “coast”.

Here’s the result roughly drawn in purple on the diagram. Of course, this is all in the realm of rough estimation!
orbit_diagram

ARE WE THERE YET ?

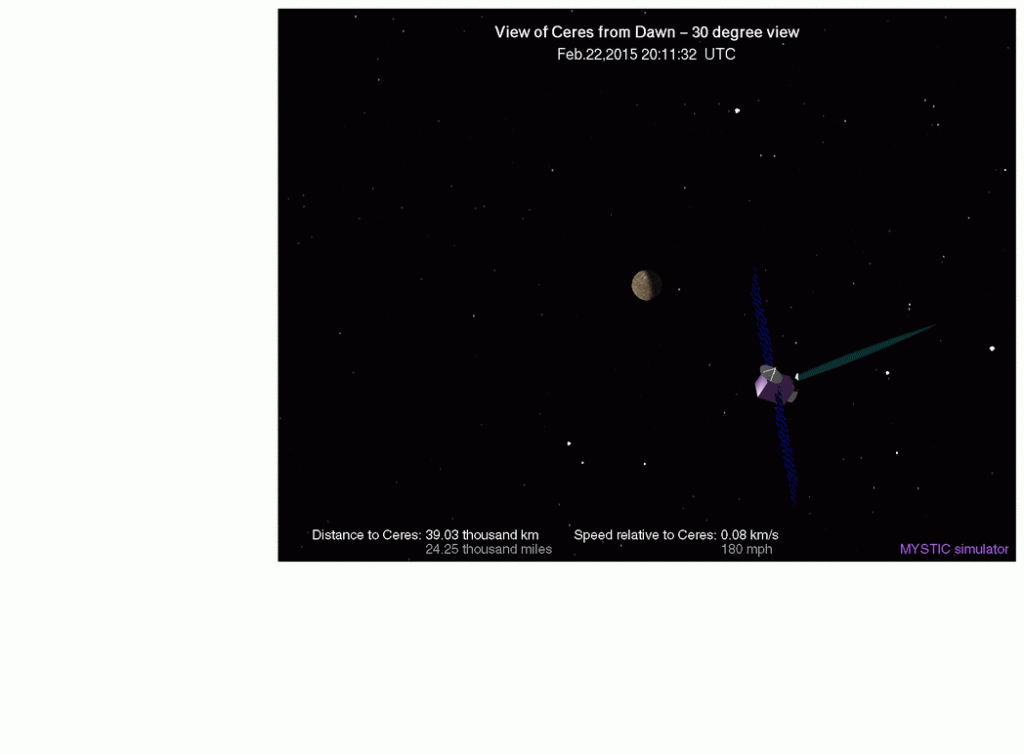
… Well, I say we are! According to a definite criterion that I will show you in this most recent animated gif: ( click to see the animation. )
output_81Cl4I

The bright star at top right is Fomalhaut in Piscis Austrinus. It’s actually visible on the southern horizon from mid-northern latitudes, but the POV is shifting to the south. and that’s the constellation Phoenix at the bottom.

But to make my point, I draw your attention to the “Distance to Ceres” caption at the bottom. Note that it “bottoms out” right at 24000 miles, and starts to increase again. DAWN is passing through “periceris” or whatever it might properly be termed. That is, a closest approach to Ceres. Of course, as it continues to “shed energy” it will spiral closer, but right now it is retaining the semblance of an hyperbolic orbit.

As we learned in physics class, the energy of a body at rest infinitely far from a gravitating body is conventionally set to ZERO. If it falls toward a gravitating body it gains kinetic energy but loses potential energy as it sinks into the “gravitational well”. So, any body with net positive energy can escape to infinity with a finite velocity, and is not bound to the gravitating body.

I say all this because the net energy of DAWN ( per unit mass ) is easy to calculate from the MYSTIC captions, and we can gauge its approach to gravitational binding by the steady diminishment that we see in this value, which is equal to 1/2 V_inf2, where V_inf is magnitude of the aforementioned “velocity at infinity”.

The value of V_inf was 115 mph in the last frame of the animation at Feb 24 06:33:54 . As of Feb 25 05:34:47, V_inf was down to 107 mph

March 10 – APOAPSIS

The “arrival” or attainment of zero orbital energy, was well noted on March 6, but there was nothing in the motion or actions of the DAWN spacecraft that would have indicated this event, such as it was. It has been “firing” its thruster steadily before during and after this milestone, as it continues to work towards its Survey Orbit. DAWN is now approaching another event, which has a more obvious connection to  its motion. That is apoapsis, as it is generically termed, or maybe apocerium, if we follow Kepler’s coinage of apohelium, which was later “greekified” to the now conventional aphelion.

As an aside, this question of what to call the “apo” point of the orbit has been bubbling along for decades, if not centuries. I only knew of aphelion and apogee, to be honest, but now I’m seeing that apoapsis, that is apo-apsis, is supposed to be the standard term, as awkward as it is. Investigating, I find that apogee derives from apogaeum, a nineteenth century analogue to Kepler’s apohelium, based on gaia, for the earth, I presume.

Of course, I became familiar with apogee from the era of “satellites” in the 50’s and 60’s, when I was quite young. I don’t see why the term can’t be applied to any planetary body, just as one speaks of Martian geology.

Well, at any rate, we are approaching the turning point of DAWN from its continuing motion away from Ceres ( despite it’s inevitable capture ) into a motion falling towards it. Following the Where Is Dawn Now? graphic on the DAWN mission page, we see that its motion is at a low point, suggesting a thrown object at its apex.. In the approximately six hours between Mar. 10,2015 00:03:54 and Mar. 10,2015 06:01:34, DAWN has decelerated from 78 mph to 76 mph, and moved 290 miles further from Ceres; from 43060 miles away to 43350 miles away. These are numbers appropriate to highway driving, not space travel!

So what happens when it “makes the turn” and starts falling towards Ceres ? I anticipate that they will turn off the thruster for a while and let it fall, but we’ll see.

March 17 – Making the Turn

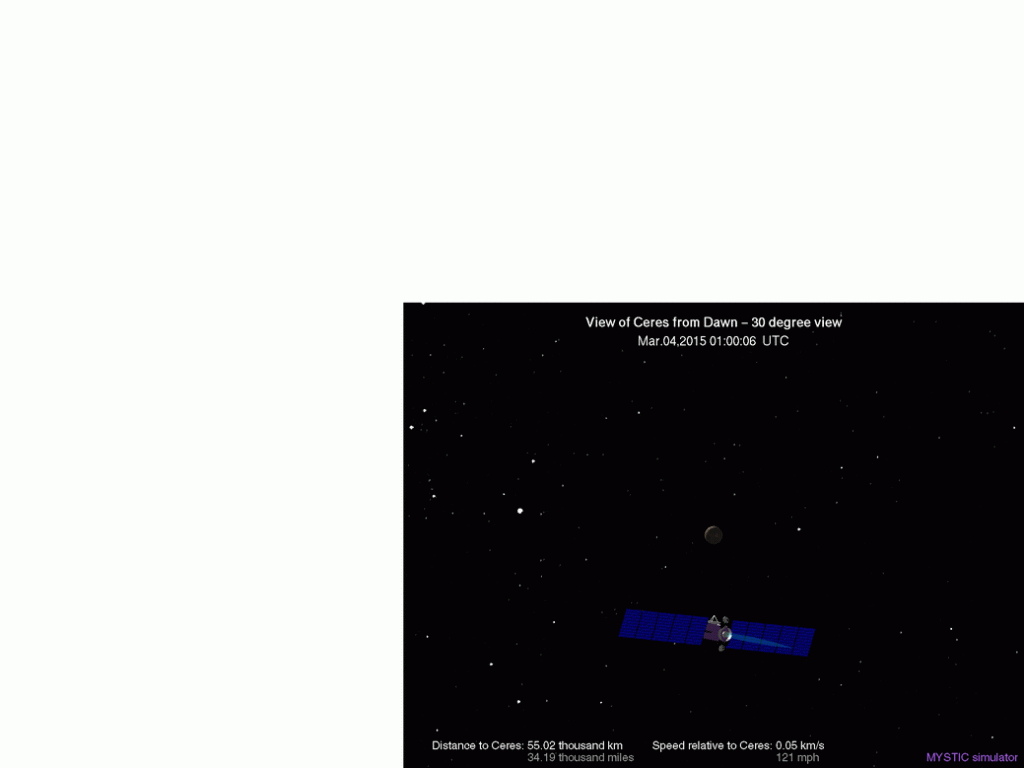
DAWN is still approaching apoapsis, but it is very near, as its speed relative to Ceres of a mere 40 mph would indicate. Here is an animated gif comprised of  1 frame per day for the 14 days March 4 thru March 17. I think you can see a slight bow in the arc of the apparent motion of Ceres against the constellation Orion as DAWN adjusts the plane of its orbit. I did the best I could to keep the star background constant, but its still not perfect, as you can see. I hope it’s good enough to allow you to picture the apparent motion of Ceres against the fixed stars from DAWN’s POV. The sun is almost coming into view just above Orion, as you can see by the almost completely dark disk of Ceres.

Note that the distance from Ceres increases from 55020 km to 77740 km during this interval as DAWN climbs to its apex. You can see the disk of Ceres diminish in size as DAWN recedes from it.
output_MbifyqMarch 25, 2015

On March 19 DAWN achieved apoapsis at 48740 miles from Ceres moving at 34 mph, and is now starting to move closer to Ceres. As of today at 10:33 UTC it has “fallen” to 46460 miles away, and is moving at 40 mph! Here we go!

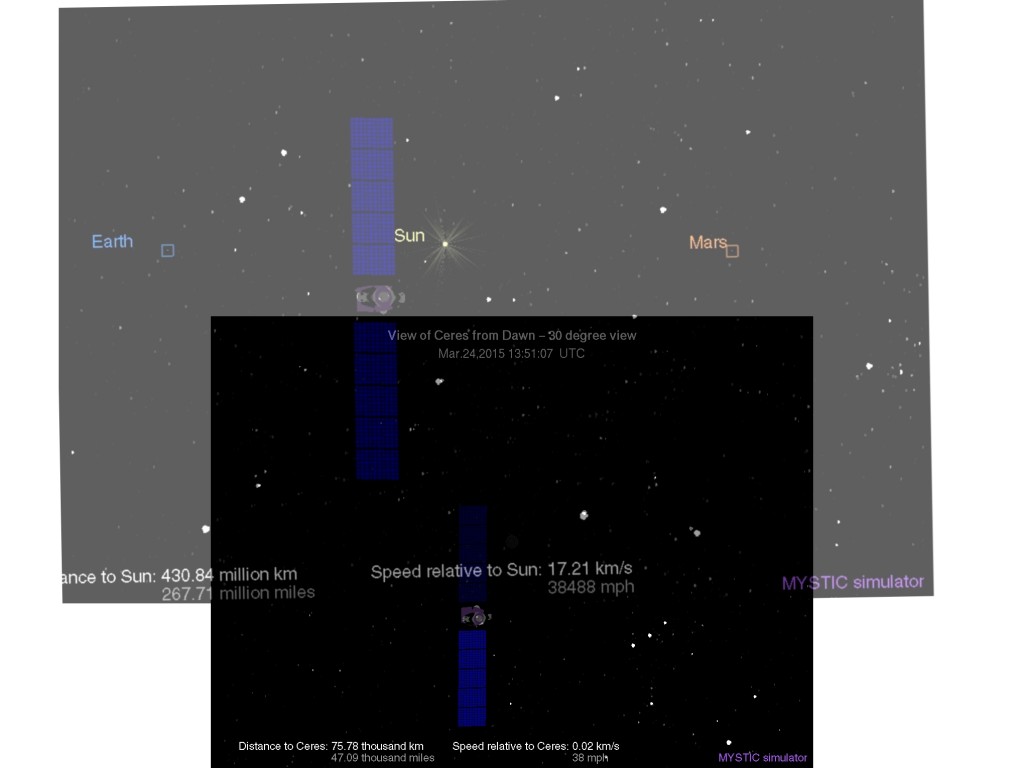
BTW, DAWN is moving towards a point almost directly opposite the sun from Ceres. WHERE IS DAWN NOW? provides views of the sun ( and other objects ) from DAWN’s vantage point, and here is an overlay showing that the sun is just about to come into view in the Ceres frame of reference … along with the earth and mars too!
sun_Mar24_3

Note that I had to expand the “sun view” and slightly rotate it to get a matching overlay.
 

Rocket Science

The explosion of the Antares rocket carrying the ISS supplies on 10/28/2014 was a great disappointment, and a severe setback for the U.S. space program.

Nevertheless, it gets my sleuthing instinct up, which in this case involves some real background study on the Antares rocket.

Also, we have the development in the News of the idea, or “meme” if you will, that the “explosion” was due to a destruct signal.

This idea, which is quite typical of news developments, is distressing to me. It all hinges on rhetoric. In this case the rhetoric of the “kill signal” sent by the range safety officer, and also the identification of “the explosion” resulting thereto.

First reports of the destruct command gave the bare facts, that the range saftey officer had initiated it “before the rocket hit the ground”, but the report I read gave the specific qualification that it was not certain whether this signal accounted for the explosion.

By appearances, the authority of the range safety officer has prevailed in the news reports, so that we are now informed that the rocket “was destroyed in a massive explosion at the launch site after safety officers sent a kill signal.”

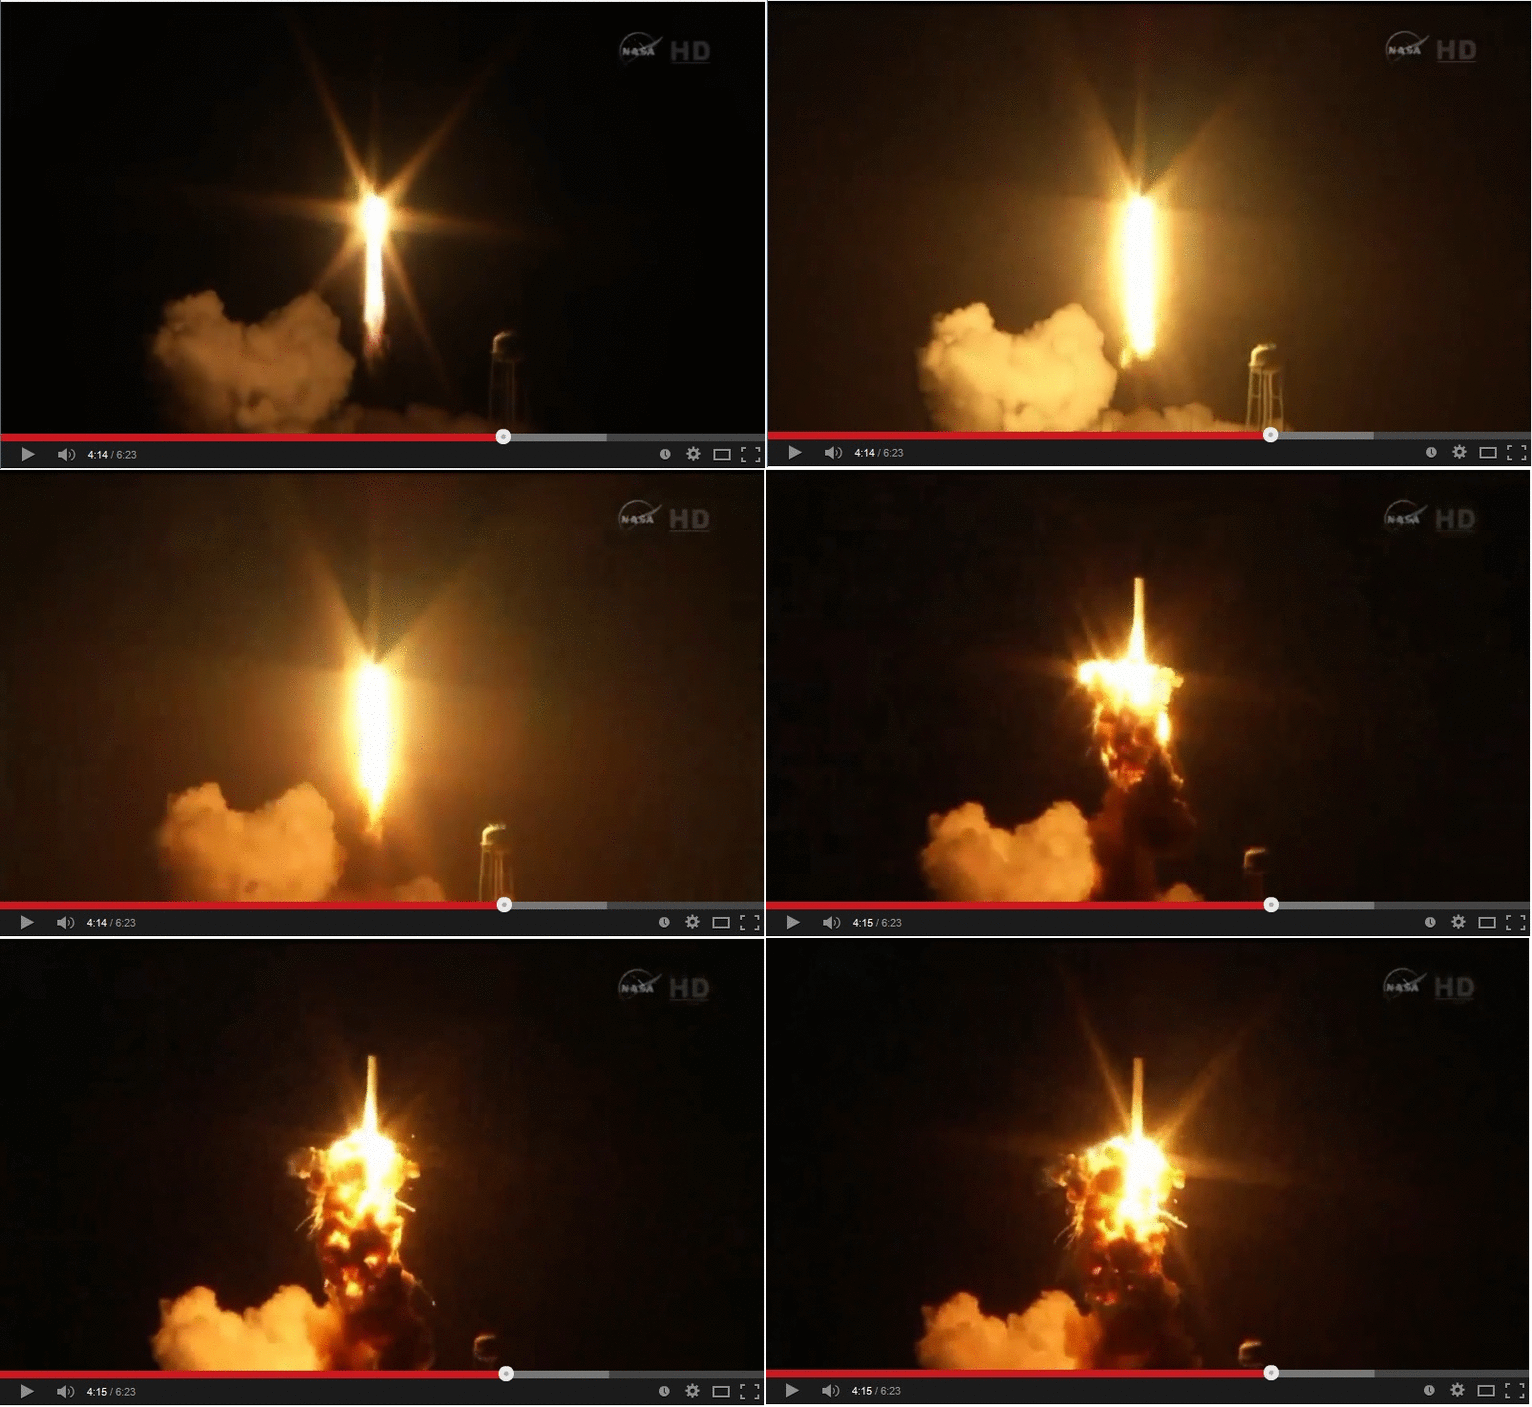
Against this idea, we may note that there were at least two explosions. An immediate explosion, apparently of an engine, within one second of the first visible anomaly, and the more famous and spectacular explosion as the rocket fell back to the launch pad. This second explosion is what is being promulgated in the news reports.

Here is an animated gif made from a rough division of the launch video obtained by “double taps” at my terminal. It spans approximately 2 seconds, as timed by the video.
output_g34UxB

Well, it simply defies credulity that the apparent explosion at the base of the rocket, in the vicinity of the engines ( there are two of them ) was initiated by a manual signal after the observation of the anomalous “flare” of the rocket plume. In fact, the “108 %” announcement is made right at this time, and verbal acknowledgement of the disaster is rather delayed.

So all I’m saying is that the 2 second interval labeled 4:14 thru 4:15 in this video is a true record of the “accident” itself. I don’t think this is particulary controversial, outside of the impression given by the news reports.

So then the question is, what happened? The flare indicates to me that there was a breach in the LOX circulation through the bell. Aside from the flare, this would have caused a drop in pressure, obviously, in the LOX feed to the engine, and to the turbine driving the pump. So things go south real fast with the flame front going “upstream” into the engine.

My conviction is that there are more than a few individuals on the development Orbital Sciences staff that knew immediately what had happened. The company has stated that the facts will be known in “days not weeks”, so any day now …

Asteroid 2014 R6

Last March I posted NOTES ON CLOSE ENCOUNTERS, describing some thumbnail math relating to the hyperbolic shape of an asteroid trajectory passing near the earth, as viewed in the earth frame of reference.

I noted that the encounter with asteroid 2014 DX110 had a very “flat” ( high eccentricity ) trajectory, based on the speed and near approach distance of 1.3125 and 54, expressed in units of earth escape velocity and earth radius. ( Not earth orbit radius! ) The rule-of-thumb eccentricity came to 185 in that case.

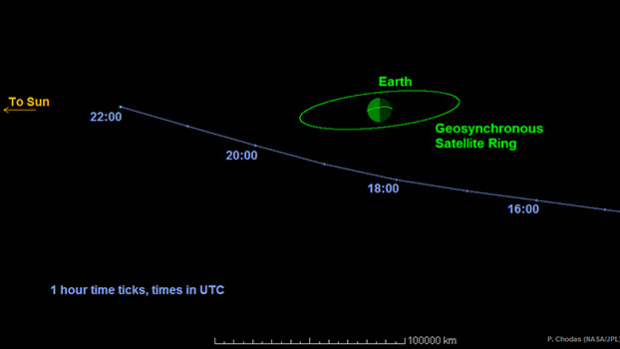
The predicted encounter with 2014 RC set for this Sunday has a much less “flat” flyby trajectory, based on the available graphic shown here:

asteroid20140903-640

From the graphic we have, in terms of my previous post, r0 = 25,000 mi = 6.3 ; v0 = 40000 km/hr = 1 ( i.e. very nearly earth escape velocity. ) So this is a lot closer and a little slower than 2014 DX110. Turning to the formula

s2 = r02 / ( 1 – 1/ ( r0 v02 ) )

… we get an “impact parameter” ( projected asymptotic approach distance ) of 1.09 r0, so 2014 R6 will actually be “drawn” about 9% closer by earth’s gravity, compared to a straight line fly-by, and the hyperbolic trajectory has an eccentricity of 11, versus 185 and a deviation of just 1/2 % in the case of 2014 DX110.

Notes on Close Encounters

The passage of 2014 DX110 is just the latest in a series of  near earth encounters that have been observed, and it raises the question, what is the likelihood of one of these actually hitting the earth, supposing a continuing sequence of them? Of course this has been going on for a long time, and they DO occasionally hit the earth, but how might we model these encounters statistically?

Let’s take the lunar orbit standard and suppose that a medium sized asteroid passes within “the lunar hoop” perpendicular to its relative direction of motion, say once a year. Then if each of these objects has a constant probability per unit area of passing through a particular point in the hoop, we need only compare the cross section of the earth to the size of the hoop to estimate the fraction of these encounters that result in a collison with the earth, and this fraction is just the square ratio of the earth’s radius to the moon’s orbit, or about 1/602 = 1/3600 .

Gravitational Focusing

But then we might ask, what about the gravitational attraction of the earth? Wouldn’t it tend to “focus” objects passing nearby and increase the effective collision radius?

I think the answer is “somewhat”, but there is a simple treatment of the problem that is interesting more for the understanding it affords than any modification of such an estimate.

Let’s directly apply conservation of energy and angular momentum to get a simple and exact answer to the idealized “two body problem” of a small object passing by the earth in an inertial frame of reference. This is actually a reasonable approximation, I think.

Conservation of energy is expressed by

1/2 v2 – MG/r = constant

and conservation of momentum is expressed by

v rperp = constant

In particular, if an object approaches the earth from a great distance with speed v1 and s is its projected straight line distance of closest approach ( measured to the center of the earth, ) then its angular momentum wrt the center of the earth is v1 s , and if r0 is the actual hyperbolic distance of closest approach, where it has velocity v0, we must have

v1 s = v0 r0

A hyperbolic Interlude

The situation is illustrated in the following diagram, which shows the hyperbolic path of an object passing the earth ( in blue ) and the asymptotes of the hyperbola in gray:

The diagram has been drawn to scale for a hyperbola with parameters a=7, b=24, which gives the focal distance of sqrt( 72+242 ) = 25, and hence the rational eccentricity of 25/7 . It’s part of a sequence of pythagorean triples with the lowest element being the sequence of odd integers beginning with three, and the two larger elements differing by 1 ..

3 4 5
5 12 13
7 24 25
9 40 41

This is of purely heuristic interest, but it gives us a sequence of “rationalized” hyperbolas with linearly increasing eccentricity.

Note that our ratio of interest, s/r0 , is also rational. 7 24 25 is the 3rd entry in the list, and the generalization holds that this ratio is (n+1)/n for the nth entry. We’ll come back to this …

Dynamics continued

We can simplify our notation by an appropriate choice of units. We note that the formula for conservation of energy, with constant set to zero :

1/2 ve2 – MG/re = 0

or

1/2 ve2 = MG/re

… is the defining equation for the escape velocity from the surface of the earth, and we can express the potential energy in terms of the escape velocity:

MG/r0 = 1/2 ( re / r0 ) ve2

Then if we measure r in units of re, and v in units of ve, Conservation of energy between the far motion at velocity v1 and zero potential energy, and the close approach v0 can be simply expressed as:

v12 = v02 – 1/r0

Note we have “multiplied through by 2” to get rid of the factor of 1/2 in each term.

Now we can use the equation for conservation of angular momentum to express v0 in terms of v1, or vice versa, and with some elementary rearrangement of terms we get these two equations for s in terms of r0 and v1, or r0 and v0 :

s2 = r02 ( 1 + 1/ ( r0 v12 ) ) = r02 / ( 1 – 1/ ( r0 v02 ) )

Notice that for large v1, i.e. much greater than earth escape velocity ( implying large v0 as well,) we have r0 = s, so the object just zooms right by. Otherwise, we have an easy formula for determining s in terms of r0 and v1 or v0 .

Impact criterion

If we set r0 = 1, i.e. the radius of the earth, we have a very simple formula for the apparent or effective size of the earth in terms of v1, expressed in units of earth escape velocity.

s = sqrt( 1 + v1-2 )

For example, for the earth to “appear” twice its diameter, the incoming speed would have to be 1/sqrt(3) = .58 , or 58% of earth escape velocity.

The case of 2014 DX110

Well what about 2014 DX110 ? It’s stated that its flyby speed was 33000 mph or 14.7 km/sec, compared to 11.2 km/sec, so v0 = 1.3125

It came within 54 earth radii at close approach meaning r0 = 54, and we can use the v0 version of our formula to get

s = 54 / sqrt( 1 – 1/ ( 54 x 1.31252 ) ) = 54 x 1.0054

s/r0 = 1.0054

… and finally

To find a rationalized hyperbola which “approaches” this case, we note ( as per above ) that (n+1)/n = 1 + 1/n, so we want n = 1/0.0054 ~= 185, so we take the 185th in the sequence of Pythagorean triples:

371 68820 68821

and eccentricty e = 68821/371 ~= 185.5

Snow from space

Here’s an excerpt from the 250 meter pixel version of the Terra/MODIS image taken at 01/03/2014, 15:55 UTC. ( The link shows the default 2km pixel image, but you can select pixel size at the left. )

The excerpt shows the southern end of the snow cover, just south of Washington, D.C., all the way up through New Jersey, Pennsyvania, and New York to Quebec and the frozen Lac Saint Jean, at top right. Note Lake Erie and Lake Ontario at left center, as well.

At the time of the image, southern New England was still under cloud cover to the right of the excerpt.  A very impressive vista!

PHABULOUS!

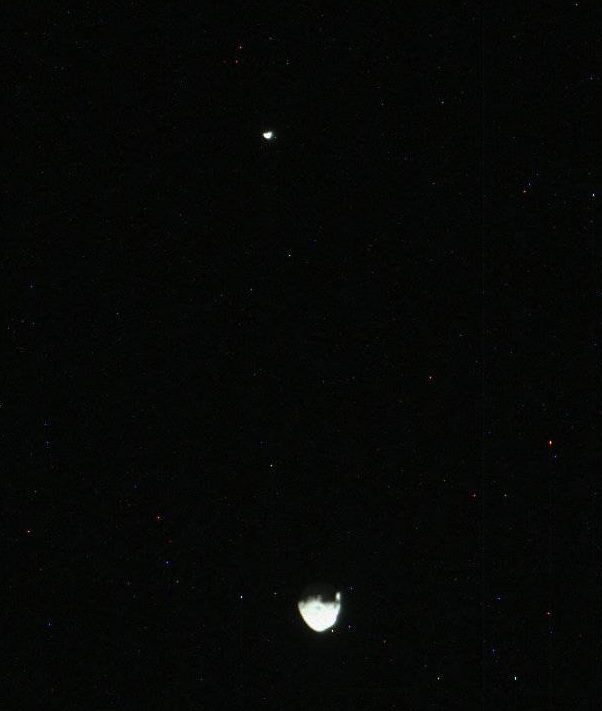
Here’s an excerpt of a sol 351 Curiosity Mastcam image catching Phobos ( at bottom ) passing by Deimos high overhead in the wee hours, local time, 2013-08-01 08:44:11 UTC as labelled in the Raw Image Gallery. You can clearly see the features of Phobos, which make it very reminiscent of the Death Star.

I can recreate this event with my Starry Night software by setting my viewing coordinates to the Bradbury landing site on Mars. However, it doesn’t seem to quite match up in detail, and I can’t even come close to identifying the background stars. So that’s a bit of a mystery to me.

I haven’t seen any publicity for this yet on the Mars Science Laboratory web site, but I guess they’ll get around to it. There was publicity for a series of Navcam photos from Sol 317 made into a movie, but that was at low resolution.

Sleuthing Chelyabinsk

Like many others, I was astounded not only by the Chelyabinsk meteor fall itself, but by the seemingly  outlandish estimates of the power of the “explosion” which was presumed to have caused the damage on the ground. I believe they’re saying 500 kilotons now. At one point I was ready to give in and go along, but in perusing the extensive Youtube material and other references, I saw others voicing many of the same points that I had thought of, for example that “there was no explosion” ( ! ) How can you say there was no explosion ! Well, because the brilliant flash lasting for several seconds traveled through the air for some miles during that time, then blinked out. What was left was a smoke trail. Then, a LONG time later, as much as two minutes it seems, there was a huge but very sharp crack that did the damage, followed by a series of much less intense bangs and pops that sounded like gunfire. It certainly seems that all of these were “sonic booms”.

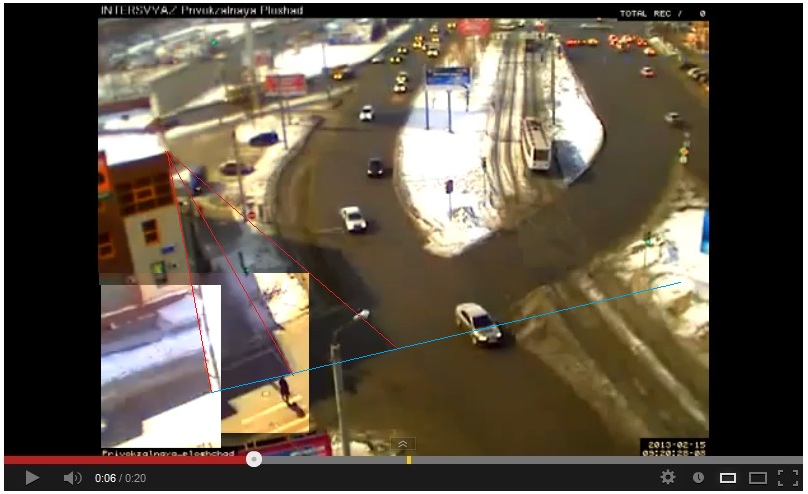
Well, enough generalities. Let’s just look at a simple analysis of the “traffic camera” video. Here’s a composite of three frames with some lines drawn on it:

The red lines are drawn from the corner of the building to its shadow at three different times, with the lapse of 2.0 seconds, and 1.0 seconds between them. The two later shadows were pasted on to the original scene. Then the blue line connecting them gives a record of the track of the meteor flash in the sky. The corner of the building has ( lat, long ) = ( 55.143470, 61.414289 ), incidentally. That was some sleuthing right there! The view is slightly to the east of due south.

Now concentrating on the last interval of one second, we see that this is near the closest approach of the meteor to this location, and eschewing trigonometry, we can estimate that the red sides of the triangle formed by the line of sight forming the shadow track, are to the blue baseline of the track, as 8 to 3. We simply note that we are looking more or less face on to the triangle from the vantage of the camera and estimate from the image.

The point is that the distance of the meteor from the location is in the same 8 to 3 ratio to the distance it flew during that one second. Suppose it was moving at Mach 10, then it flew about 2 miles in that time, and the distance is then 16/3 miles, or say 6 miles … not very far away! We may suppose about 4 miles high and 4 miles along the ground.

I had first noticed that the elevation above the horizon changed considerably among the videos that seemed to be taken around the Chelyabinsk area. ( There is one stated to be from Magnitogorsk, which is 150 miles away. The angle of view looks right, but 4 miles only gives you about 1.5 degrees above the horizon. It was very low, actually, so I’m sticking with my estimates for now. )

In several videos people are standing around gawking at the smoke trail when the big bang comes. I saw a comment saying that the bang was produced earlier and this is why it arrived so late, as the meteor outran it over a long distance. I had started thinking that myself when I decided that the smoke trail couldn’t be 20 miles high, and 500 kilotons just does not compute!

Anyway, I think the shadow videos ( there’s another of the Chelyabinsk city square ) are very robust evidence.


Update:

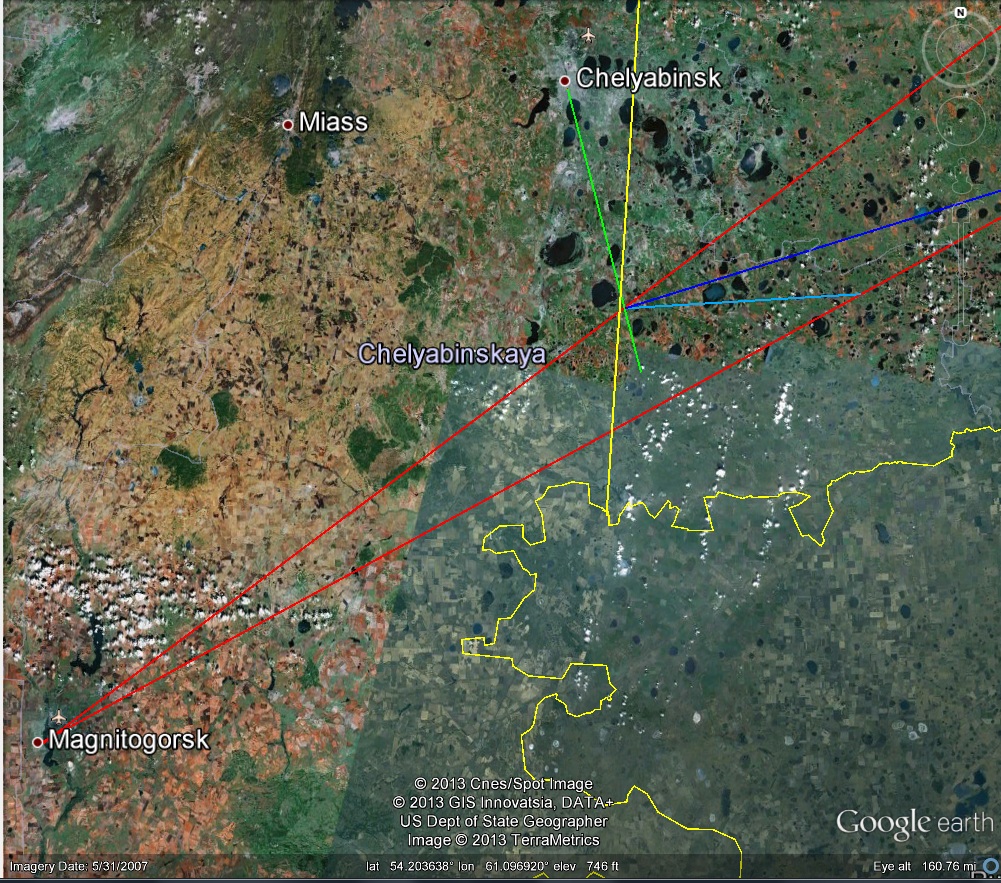
I sleuthed the location of the Magnitogorsk video, which enabled me to get a triangulation on the meteor path based on local landmarks. The red lines on the Google Maps screen shot are my estimates of the lines of sight to the first appearance ( on the right ) and the flareup from the site. Being at right angles to the Chelyabinsk lines of sight estimated from the shadow video, I think it gives a pretty good location, although far from exact. It’s much further south of Chelyabinsk than I had been thinking, which means it’s a lot higher ( ahem ). The yellow line is a line of sight to the flareup from Kamensk-Uralsky, about 100 miles north of Chelyabinsk. The dark blue line is parallel to the ground track of the shadow in Chelyabinsk, and the light blue line is an attempt to account for the tilt of the trajectory, which means it must be displaced that way, but maybe not that much.

BTW, putting the track to the south this way makes a discrepancy with its placement in the weather satellite photo, so that’s another problem. One must have patience.

Update 2:

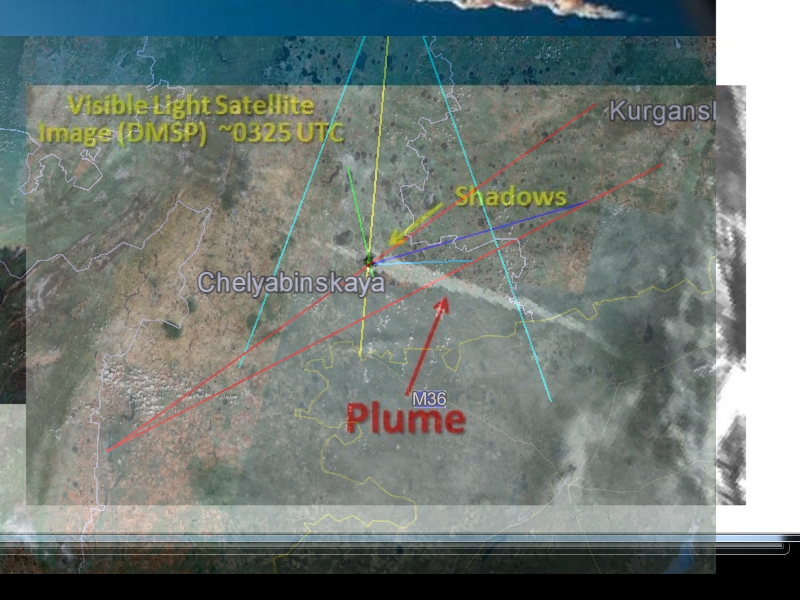
Here’s a Colorado State University montage incorporating an annotated version of the extant weather satellite image of the Chelyabinsk Meteor plume ( btw, that’s “che YAH binsk”, as I hear it in Russian reportage ) :
… and here’s an overlay of my marked up Google Earth image from above, aligned using the dark spots which appear near “Chelya..” as above:

The “dark spots” line up very well, so the overlay seems accurate. Note the excellent agreement of my line-of-sight location of the “flash” with the “plume turrets” identified by CSU. Note also my UNDERestimation of the effect of the inclination on the estimation of the ground track based on the shadow track. The extra light blue lines radiating from Kamensk-Uralsky are my estimate of the extent of the visible smoke trail in the seconds after the flash. This includes a significant length to the west of the flash, as shown also in the CSU montage.

So, I guess I should be happy now, but I still can’t bring myself around to 500 kilotons!